Distribution plots
Distribution plots provide a graphical representation of the distribution of a variable. In Mineotaur, there are three distribution plot types, which can be selected from the Plot type selection box from the Distribution plot query menu.
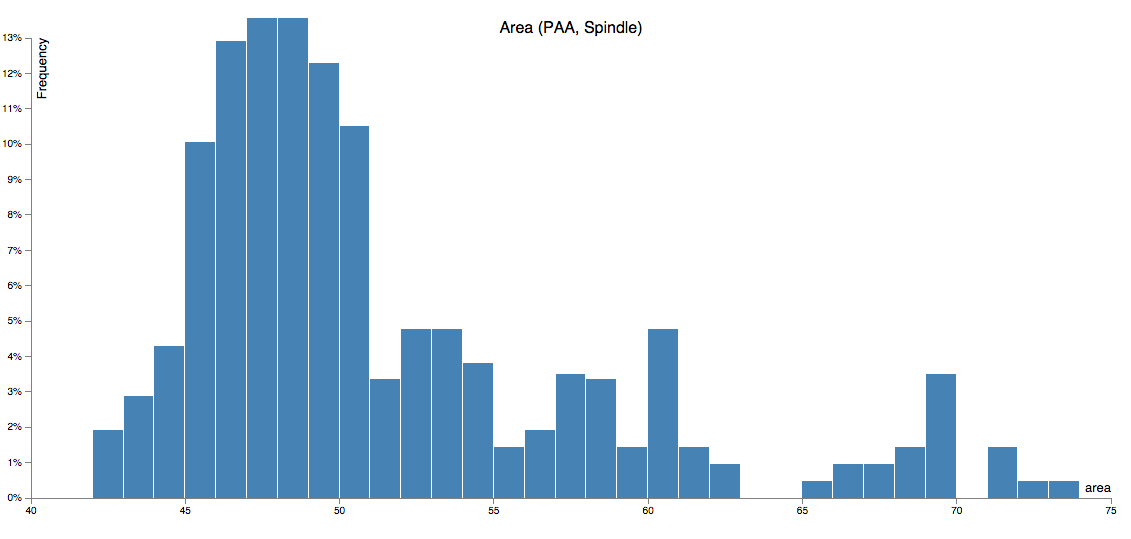
Histogram
Histograms shows the frequncy of variable values along the selected dataset. The binning of the histogram is automatically calculated based on the data.
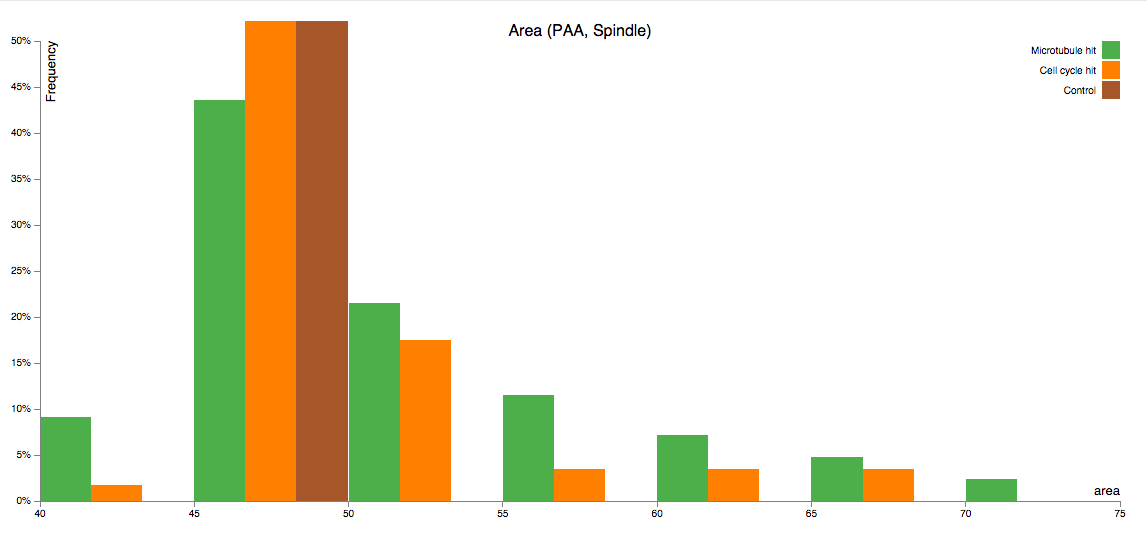
Multihistogram
(Group level only) Multihistograms shows the frequncy of variable values along the selected dataset where the data is split according to the annotations assigned to the data points. The histograms belonging to the annotations are shown in different color. The legend is provided in the top right corner.
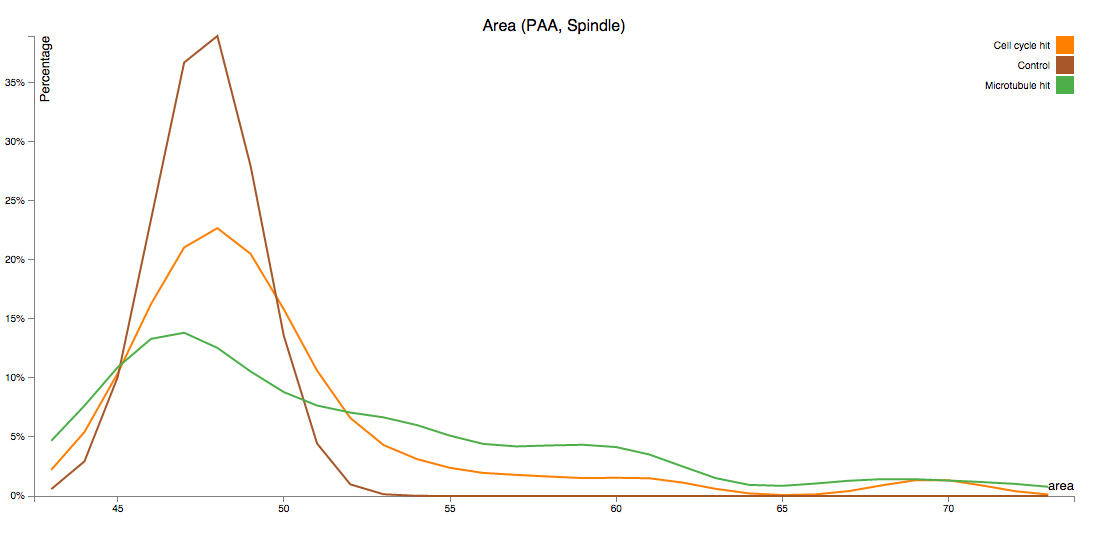
Kernel Density Estimation
Kernel Density Estimation plots show a continious approximation of the distribution with a Gaussian function fitted to the data. In group level plots, the different colors refer to the data point annotations. The legend is provided in the top right corner.