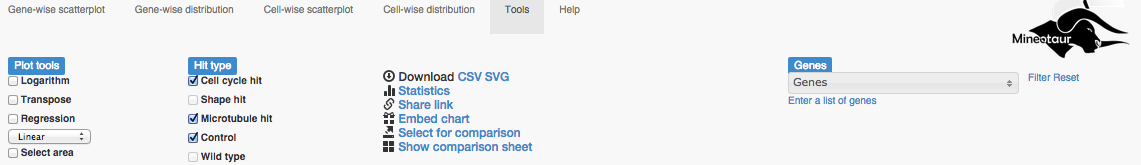
The Tools menu
Now, the Tools menu is enabled, allowing different action to be taken regarding the current plot.
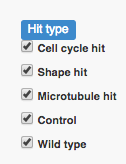
Filtering by hit Type
Just like for querying, the data points can be also filtered once the plot has been loaded. Unchecking and checking the boxes removes and puts back all queried data points for the respective hit types.
Other plot tools
There are also several tools to export, share or analyze the plots further.
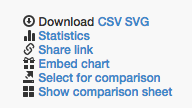
Download
By clicking on the CSV or SVG link, the raw data for creating the plot or the plot itself in a vectorgraphial format can be downloaded, respectively.
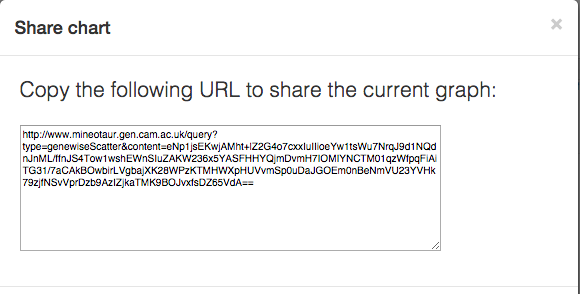
Share link
A permanent link for each plot can be generated with Mineotaur. The permanent link can be pasted in any browsers address bar and it will load the appropriate plot. The link has no expiry date, it invokes a mechanism which will recreate the plot.
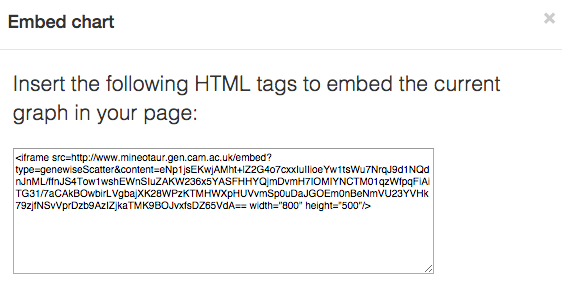
Embed link
Similarly to link sharing, an HTML snippet can be generated to each chart to embed it into an HTML page.
Comparing charts
Multiple (up to 4) plots can be shown alongisde each other on a comparison sheet. By clicking on the Select for comparison link, the current plot is copied to the next available position in the comparison sheet.
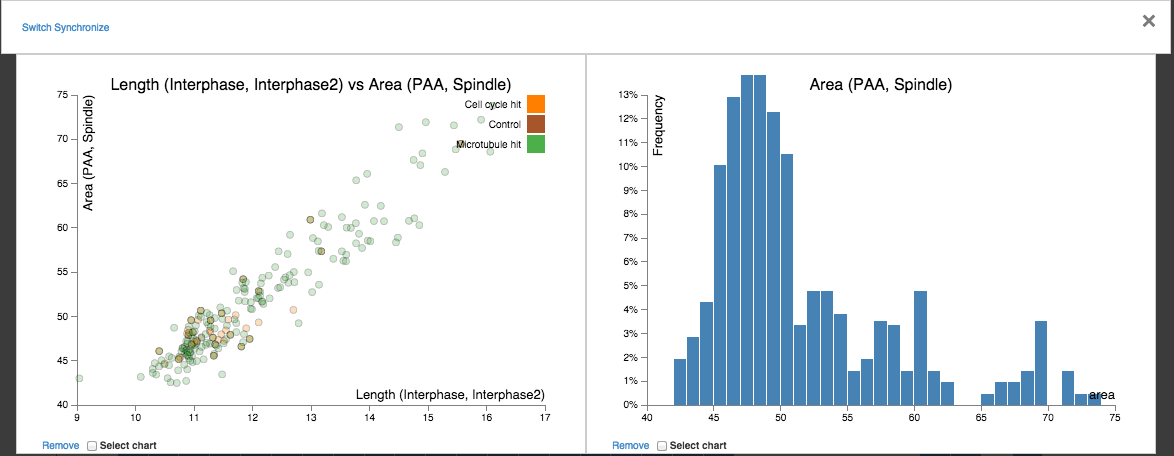
Once the plots are loaded, they can be removed, switched and plots from the same kind can be synchronized. That is, their axes are set to the same value, allowing straightforward visual comparison.