Query tools
Variable selection
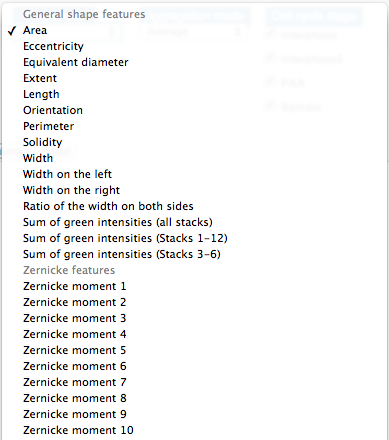
First, the two variables (properties) to be shown needs to be selected.
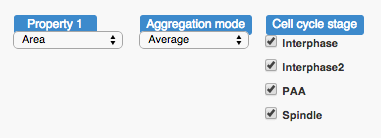
Clicking on the selection panel shows the available variables.
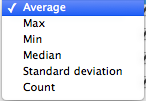
(Group level scatterplot only)The group level variables are aggregated from the descriptive level data. The aggregation mode selection panel allows the selection of how the group level value are supposed to be caluclated.
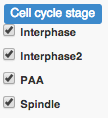
Finally, the descriptive data can be filtered via a filter property. That is, in this example only those cells are used in the query, which are in the selected cell cycle stage.
Filtering by annotation
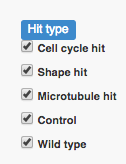
The queried group objects can be filtered by their annotations. For example, only genes with a certain hit type associated are shown:
Group selection
Finally, we can select what group objects what we want to show on the plot. For descriptive level scatterplots, it is done by selection the object of interest from a list:
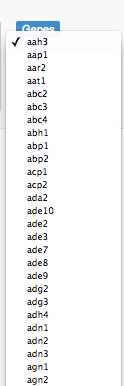
For group level scatterplots, the selection can be done by selecting objects from a selection menu:
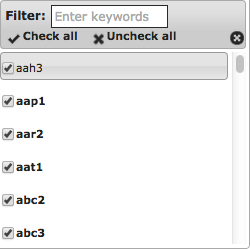
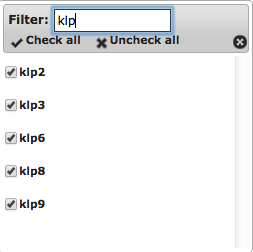
The search box on the top of the menu enables quick lookup of the objects included in the screen:
As an alternative, one could use the free text input by clicking the “Enter a list of genes” link below the selection box.
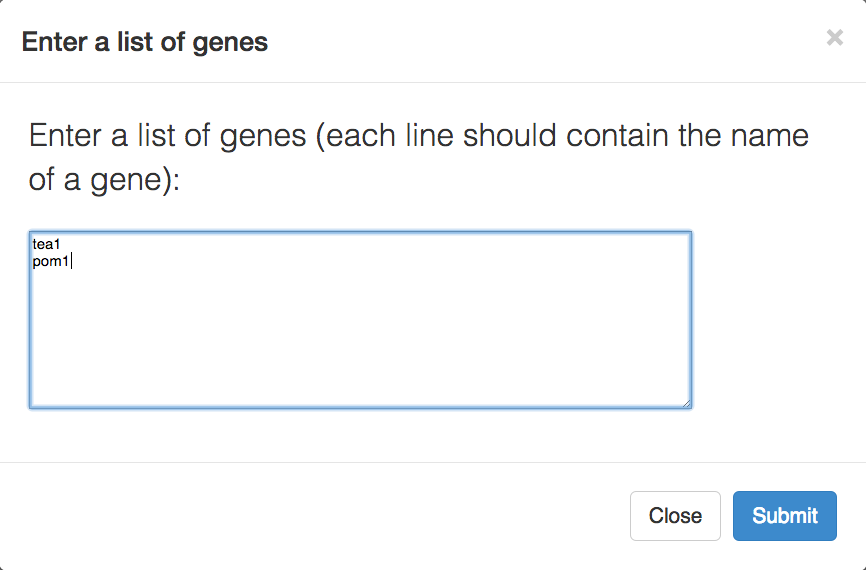
The entered gene names will be validated and the ones included in the screen will be selected. Once every option is selected, the submit button needs to be clicked. If you want to start over, click the Reset button which will turn every option to be their default settings.